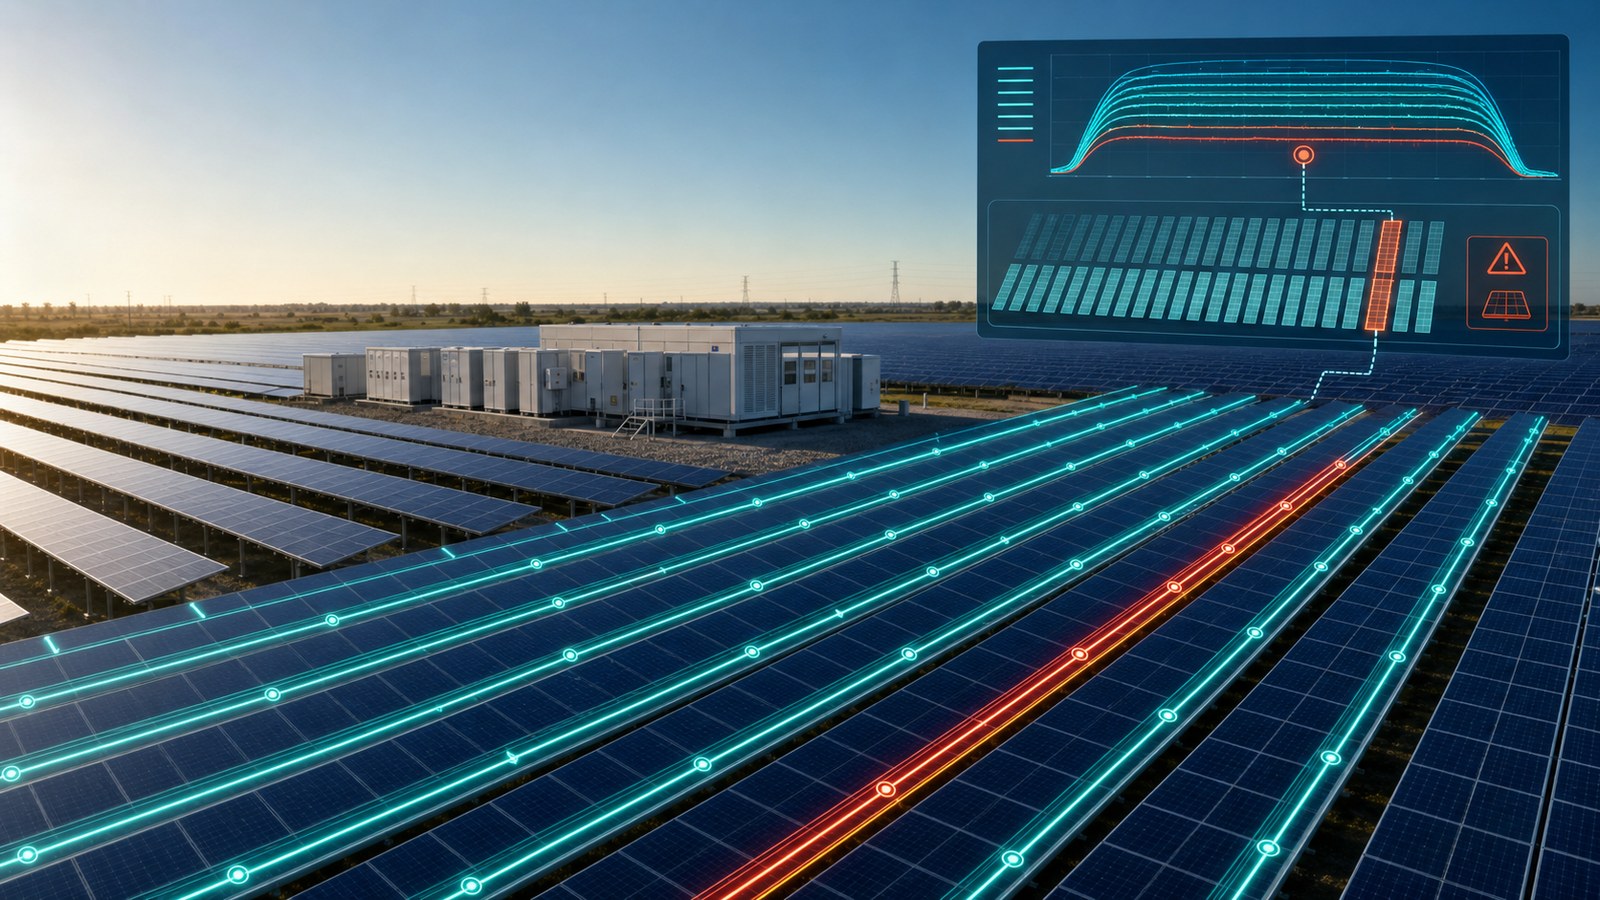
A solar plant can appear “green” on the dashboard while one string delivers less current than its peers for weeks. Total inverter power may remain high enough to avoid a general alarm, and the revenue meter still records energy. The loss, however, is quietly accumulating deep inside the DC array.
The owner asks, “Which part of the plant is operating below its potential?” If the O&M team has only inverter-level data, the answer is often: “We need to visit the site and measure the strings one by one.”
String monitoring closes this information gap. It is not merely a screen full of amperes and volts; its purpose is to turn the behaviour of each module string into actionable evidence for owners, EPC contractors, and operations teams.
What exactly is PV string monitoring?
In a photovoltaic array, modules connected in series form a string. Multiple strings connect to inverter MPPT inputs or DC combiner boxes. String monitoring means recording and analysing at least the DC current of each string and, where the architecture supports it, voltage, power, connection status, and the I‑V curve.
Measurements may come directly from string inverters, a String Monitoring Unit inside a combiner box, or independent measuring equipment. The SCADA system then associates each value with the correct timestamp, inverter, MPPT, zone, and physical location.
IEC 61724-1:2021 defines the international framework for terminology, equipment, and methods used in PV performance monitoring and analysis.[1] IEA PVPS O&M guidance explains that string-level monitoring provides more precise troubleshooting and higher spatial granularity than inverter-level monitoring. It recommends measuring current and voltage for every string with a resolution of at least 15 minutes.[2]
Why is total inverter power not enough?
Consider 20 similar strings connected across an inverter's MPPT inputs. If one string loses 30 percent, the effect on aggregated inverter power may be roughly 1.5 percent—small enough to disappear among natural changes in irradiance, temperature, grid curtailment, and measurement uncertainty.
At string level, the same problem is obvious: 19 strings form a consistent band while one remains persistently below it. Monitoring can therefore reduce the search area from “the entire plant” to “a specific input on a specific MPPT or combiner box.”
Sandia's Regional Test Centers note that subarray-, string-, and module-level monitoring is useful for identifying component failures, uneven soiling, and possible degradation. The additional implementation and maintenance cost must still be considered during design.[3]
What can string data reveal?
- Complete string outage: a blown fuse, open connector, cable discontinuity, or communication problem may drive measured current to zero or near zero.
- Partial current loss: shading, localised soiling, module failure, current limitation, or an incorrect number or type of modules.
- Mismatch: differences among modules force series and parallel components away from their individual maximum-power points. Sandia expresses mismatch loss by comparing actual DC array output with the sum of module MPP power after DC wiring losses.[4]
- Abnormal voltage behaviour: a shorted bypass diode, incorrect module count, or disconnected section can change voltage and I‑V curve signatures.
- PID, cracks, and hotspots: current data alone does not prove the root cause, but it identifies the string that should receive I‑V testing, thermography, or targeted inspection.
- Gradual decline: a multi-month trend relative to peers may expose changing behaviour before a complete outage occurs.
Sandia-published research using field-collected string I‑V curves has examined how analytical and machine-learning models distinguish baseline, partial-soiling, and cracked-module signatures. The operational lesson is that accurate string data is a valuable input for advanced diagnosis, but algorithmic results should still be confirmed against physical conditions and field inspection.[5]
Why have major manufacturers adopted it?
String monitoring is no longer an experimental feature. Its presence in products and platforms from major manufacturers reflects its role in data-driven O&M:
- Huawei FusionSolar includes string-level management and Smart I‑V Curve Diagnosis in its utility-scale offering to identify underperforming or faulty strings. At the Kela hybrid project, online scanning is used to inspect millions of modules and localise defects.[6]
- Sungrow explicitly lists “PV string current monitoring” in the 2025 SG350HX datasheet. Its iSolarInsight platform describes fine-grained monitoring across block, equipment, and string health, together with online I‑V curve diagnosis.[7]
- SMA describes continuous input-current measurement and detection of partial or complete string dropouts in the Sunny Central String-Monitor.[8]
These examples are not commercial endorsements. The important point is that owners and EPC contractors should define, before procurement, the accuracy, interval, protocol, and data-access rights for string measurements from inverters, combiner boxes, and SCADA.
Calculation one: peer-to-peer comparison
A raw comparison of two currents is not always valid. A peer group should first contain genuinely comparable strings: the same module model and count, similar orientation and tilt, compatible electrical conditions or MPPT grouping, similar tracker position, and no intentional design difference.
A reference resistant to outliers
For a peer group, median current can be used as the reference:
Iref = median(I1, I2, ... , In)
Deviation of string i:
Di(%) = 100 × (Ii − Iref) ÷ Iref
If the group reference is 12 A and one string delivers 9.9 A, its deviation is approximately −17.5 percent.
Where strings have different DC ratings, current or power should be normalised by each string's installed capacity. An alarm should also not be triggered by one brief sample. A practical rule might be “more than 15 percent deviation for three consecutive valid intervals,” but this is not a universal IEC threshold. It must be tuned for module technology, sensor accuracy, climate, and project contracts.
Calculation two: converting string loss into energy and money
For a quick operational estimate among comparable strings, the current deficit can serve as a first approximation of DC power loss:
Loss Fraction ≈ max(0, 1 − Istring ÷ Iref)
Then:
Estimated Energy Loss = Expected String Energy × Loss Fraction
Illustrative calculation for a 10 MWdc plant
Assume the plant contains 800 equal strings, giving approximately 12.5 kWp per string. Ten strings operate 25 percent below their peers for one month. Average peak-sun-hours are 5.5 per day.
Expected energy per string = 12.5 × 5.5 × 30 = 2,062.5 kWh
Loss for ten strings = 2,062.5 × 25% × 10 = 5,156 kWh ≈ 5.16 MWh per month
Monthly financial loss is: 5,156 × the sales or economic value of each kWh.
This is a screening and prioritisation calculation, not a contractual settlement method. A defensible value should incorporate plane-of-array irradiance, module temperature, availability, grid curtailment, clipping, DC/AC losses, revenue-meter data, and an appropriate expected-yield model.
When do string alarms become misleading?
The greatest operational risk is producing thousands of low-quality alarms. Analysis should exclude invalid conditions such as:
- sunrise, sunset, and very low irradiance
- fast-moving clouds combined with asynchronous equipment polling
- inverter clipping or grid curtailment
- different array orientations, tracker angles, or intentional shading patterns
- strings with different module models or counts
- communication loss, frozen values, incorrect register scaling, or unsynchronised timestamps
- partial cleaning or temporarily uneven soiling
Test conditions are also important for specialised I‑V scanning. For example, Huawei guidance for its diagnostic function calls for stable irradiance of at least 600 W/m², consistent module cleanliness, and identical module type and count in comparable strings.[9] These are vendor-specific operating conditions that illustrate the importance of data validity; they are not a universal threshold for every monitoring platform.
How Harmony SCADA closes the operational loop
Value is created when string measurements move beyond a separate screen and enter the plant's operating workflow. Based on Harmony SCADA capabilities, that chain can include:
- collecting string current, voltage, power, and status from compatible equipment through Modbus TCP/RTU and SunSpec
- configurable polling and prioritisation of critical measurements to manage industrial-network load
- peer-to-peer comparison and visual classification of stable, suspect, and critical strings
- combining string data with irradiance, module temperature, inverter power, and expected production
- recording alarm severity, start time, operator acknowledgement, and event history
- linking an event to the site map, SLD, and physical equipment location
- creating and tracking a CMMS work order
- technical and financial reporting of event duration, lost energy, and revenue impact
This turns string monitoring from a current chart into a complete loop of detection, localisation, action, and verified outcome.
Owner's checklist for EPC contracts and plant handover
- Naming structure: every String ID must be traceable to its block, inverter, MPPT, combiner, and physical row.
- Digital as-built data: record module model and count, DC rating, orientation, tilt, and cable configuration for each group.
- Data ownership: define the owner's access to raw data, history, APIs, and exports without permanent dependence on one manufacturer's portal.
- Register map and scaling: hand over the address, data type, unit, scale factor, and quality definition of every variable.
- Time synchronisation: inverters, data loggers, and SCADA servers should use a coordinated time source.
- Acceptance baseline: under valid conditions, record and approve string currents, representative I‑V curves, and peer-group dispersion.
- Data quality: define acceptable completeness, latency, outliers, and communication-loss limits in the contract.
- Alarm matrix: specify threshold, persistence, severity, responsible role, and response SLA for each alarm.
- Confirmation workflow: verify analytical alarms with appropriate field methods such as a clamp meter, I‑V tracer, or thermography.
Is monitoring every string always justified?
The answer depends on plant size, inverter topology, site-access cost, energy value, warranty conditions, and failure risk. In some modern inverters, string-current measurement is integrated and the incremental cost is limited. In other architectures, sensors, communications, commissioning, and maintenance must be included in the cost-benefit analysis.
For a utility-scale owner or multi-site portfolio, the value is not limited to finding one weak string. It includes shorter troubleshooting, targeted dispatch, warranty evidence, ranked O&M actions, and prevention of repeated small losses across hundreds of strings. A 2026 IEA PVPS report similarly connects quality management, performance monitoring, and data-driven operations with technical and economic value throughout the project lifecycle.[10]
Conclusion
String monitoring does not replace electrical inspection, thermography, or I‑V testing. It tells the team where, when, and with what priority those activities should occur. As plant size increases, the gap between seeing total power and seeing the actual cause of loss becomes increasingly valuable.
A successful solution needs three things: trustworthy data, valid comparisons, and an action workflow. Without them, millions of records are merely stored. With them, the same records can become recovered generation, lower O&M cost, and defensible evidence for the owner.
Can every string in your plant be traced and acted upon?
Submit your project details for a technical review of data acquisition, peer grouping, alarms, and production-loss reporting with Harmony SCADA.
Request a technical project reviewReferences
- IEC 61724-1:2021 — Photovoltaic system performance, Part 1: Monitoring
- IEA PVPS Task 13 — Guidelines for Operation and Maintenance of Photovoltaic Power Plants
- Sandia Regional Test Centers — Technical Approach to Validation
- Sandia PVPMC — Mismatch Losses
- Sandia / IEEE Access — Classification of String-Level I‑V Curves from Physically Induced Failures
- Huawei FusionSolar — Utility-Scale Smart PV Solution
- Sungrow — SG350HX Datasheet, Version 23 (2025)
- SMA — Sunny Central String-Monitor Technical Description
- Huawei — Smart I‑V Curve Diagnosis: Prerequisites and Operating Conditions
- IEA PVPS Task 13 (2026) — Photovoltaic Project Decisions: Quality, Performance, and Economic Value