HARMONY SCADA
Intelligent Solar Power Plant Management System
Next-Gen Monitoring
Smart
Smart
Solar Power Plant Management
Take control of your data. Real-time monitoring, advanced analytics and full control over plant performance with a modern, stunning interface.
0
System Uptime
7
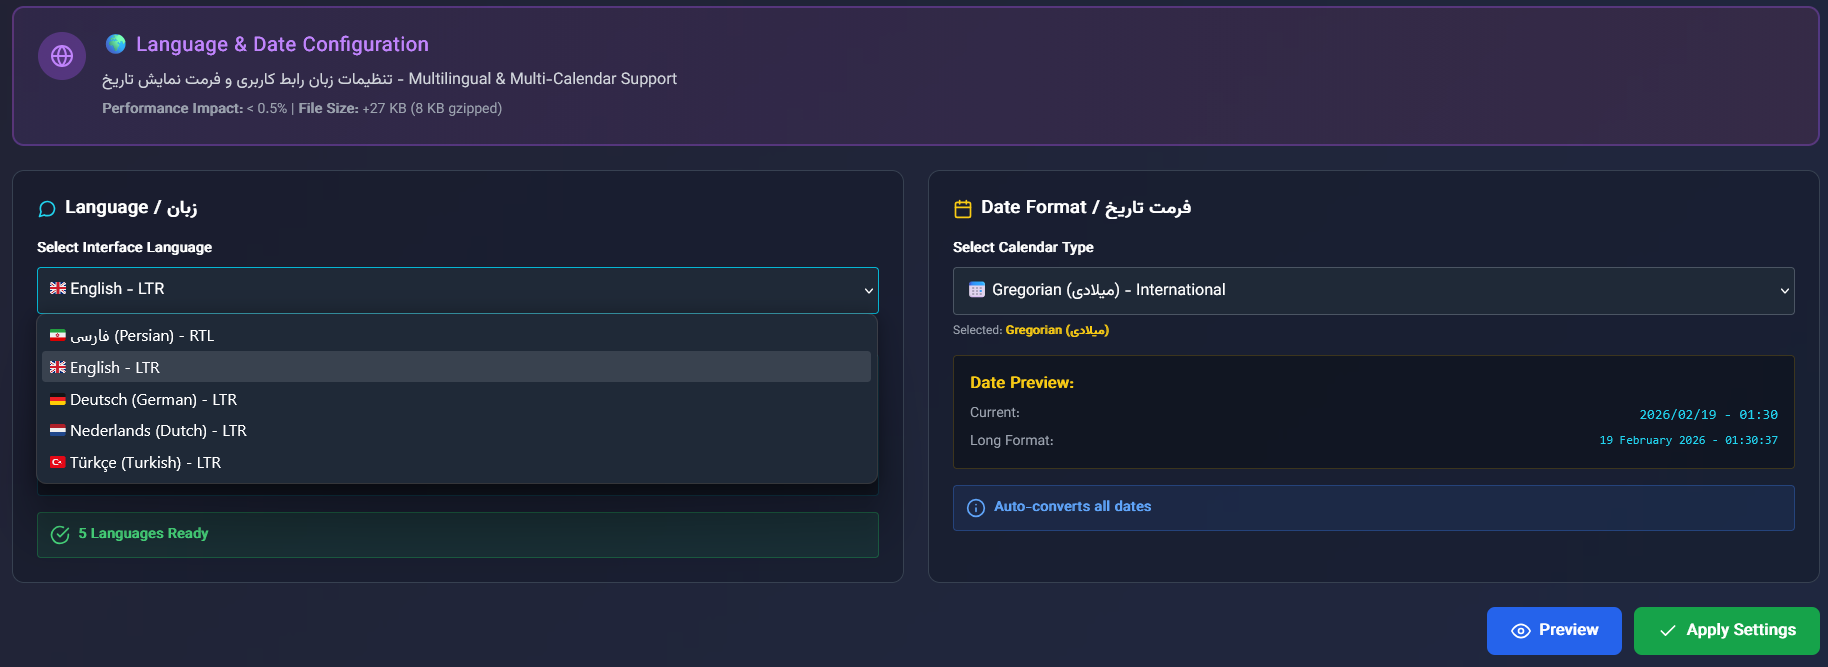
Languages Supported
24/7
Technical Support
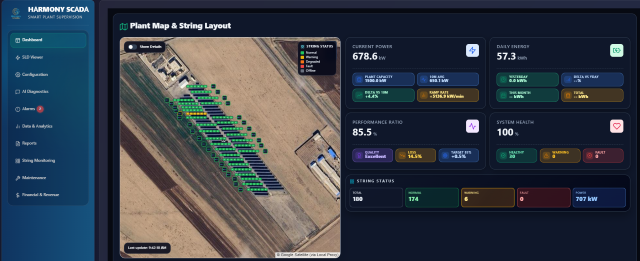
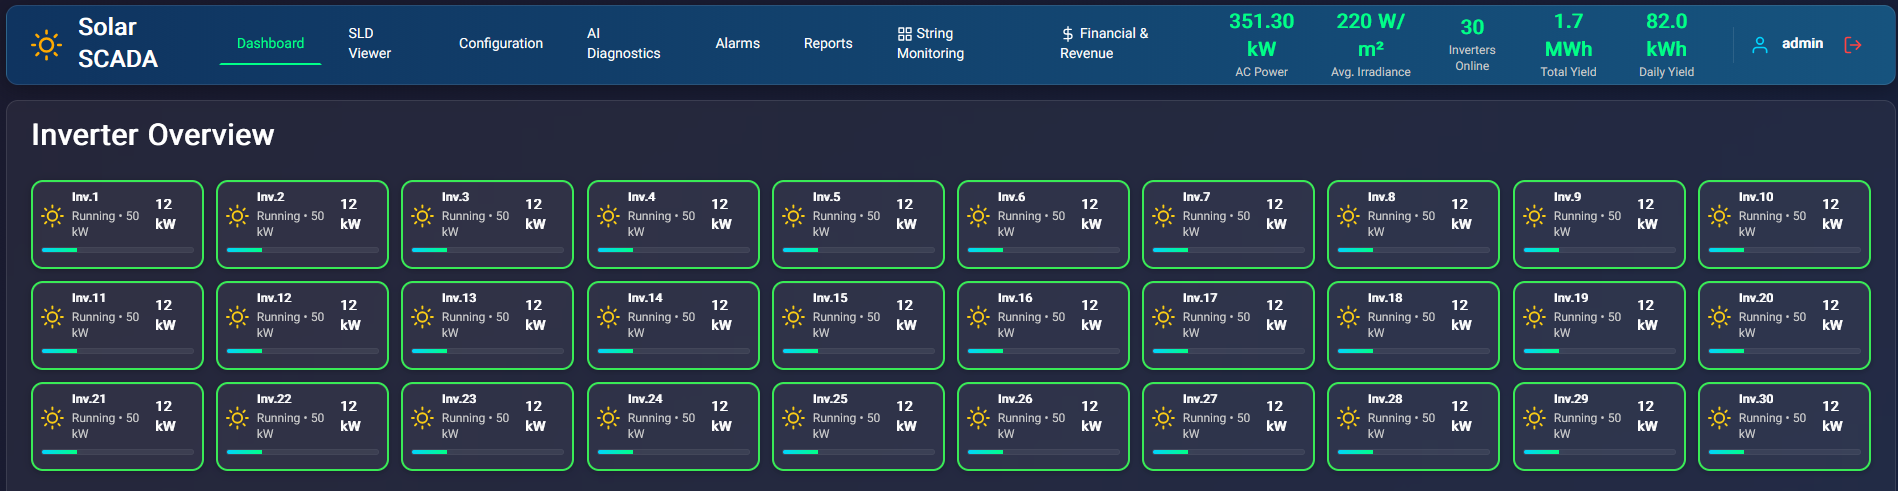
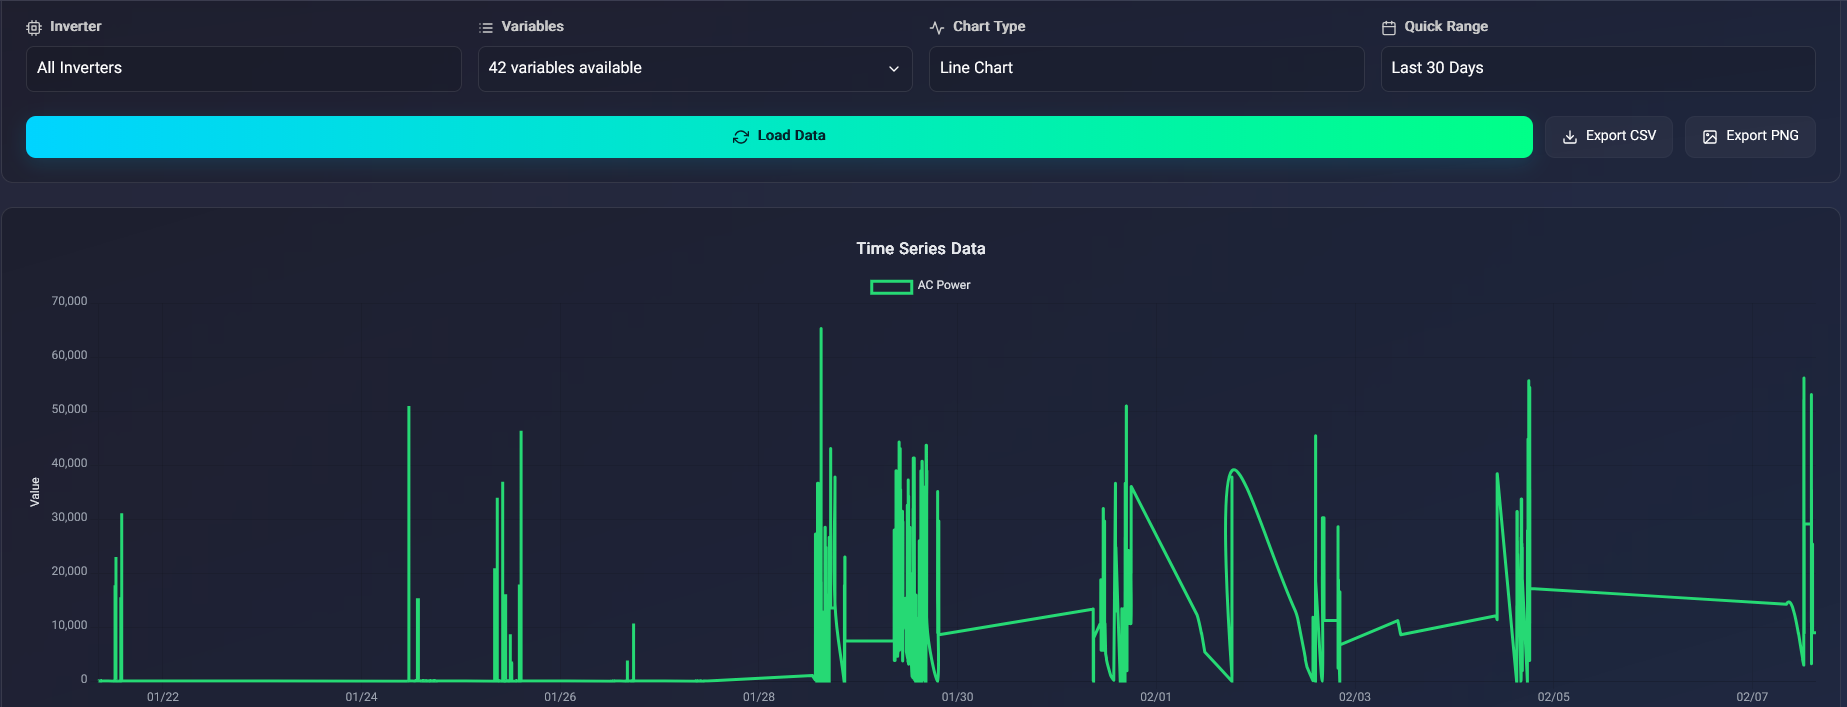
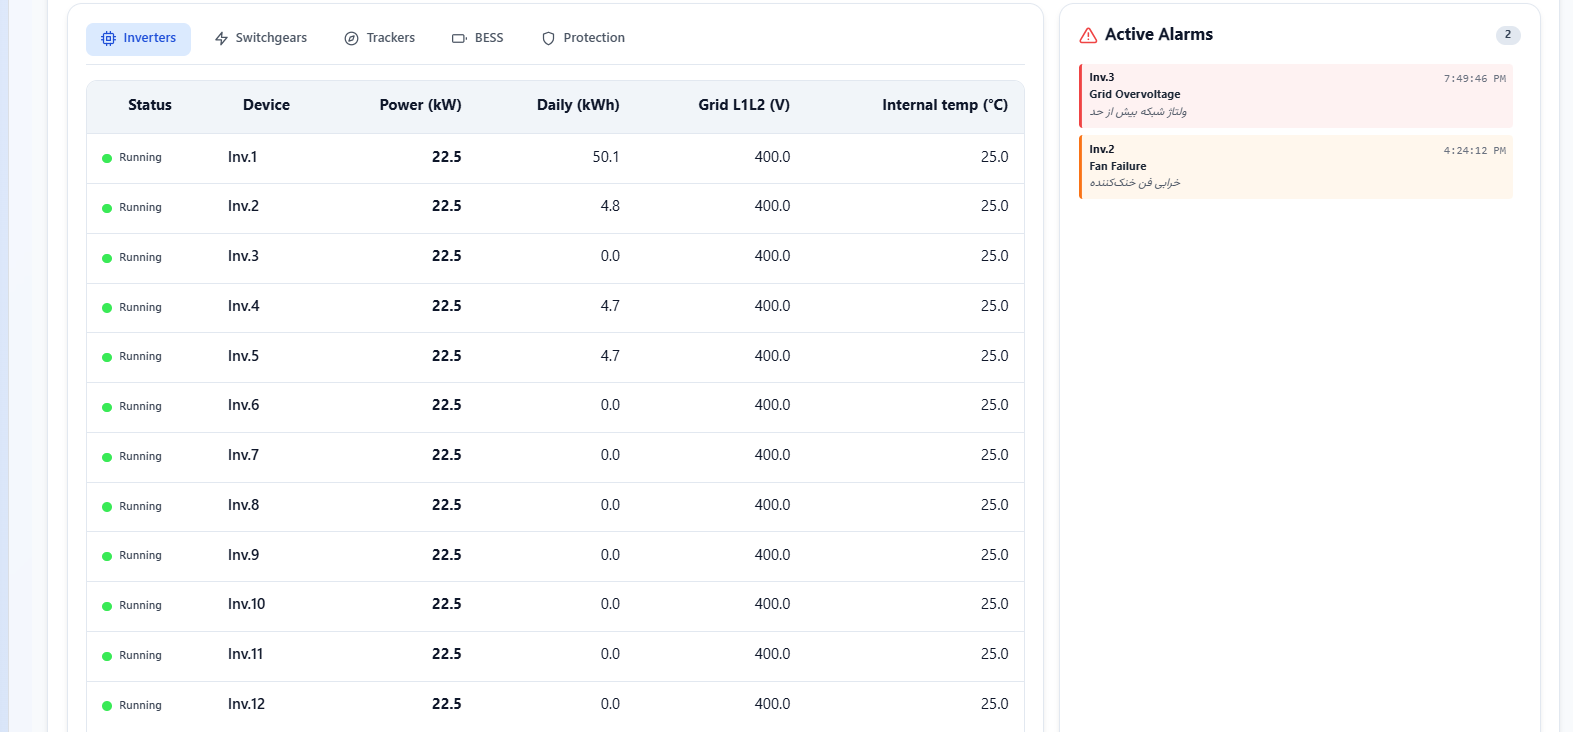
Real-Time Monitoring
Live tracking of power generation, Performance Ratio (PR), and inverter status with sub-second resolution.
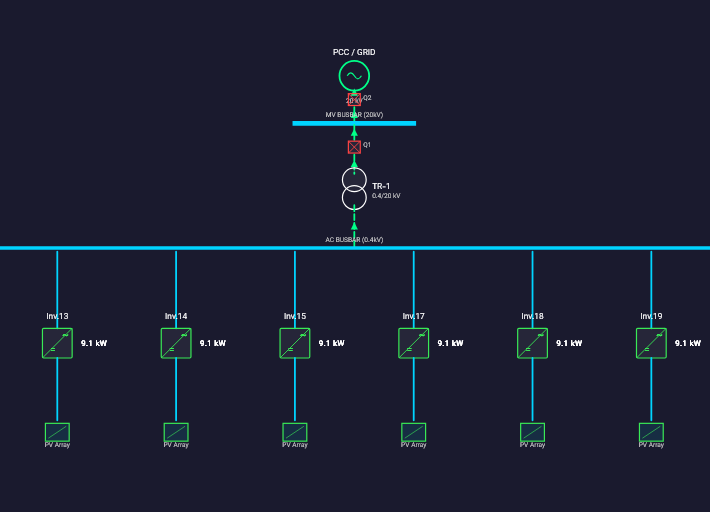
SLD Designer
Graphical layout builder with measurements dynamically displayed on active system components.
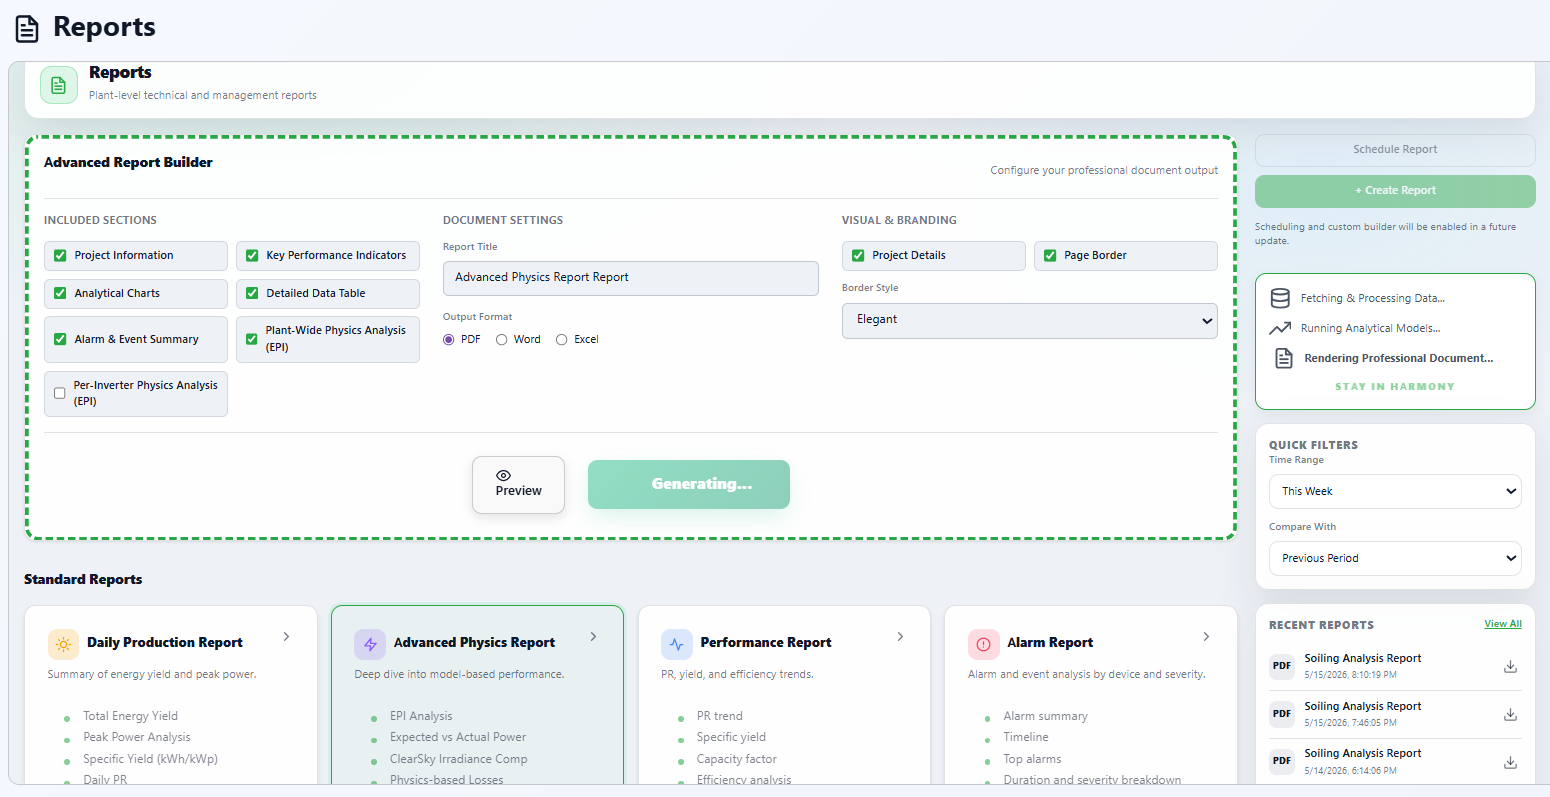
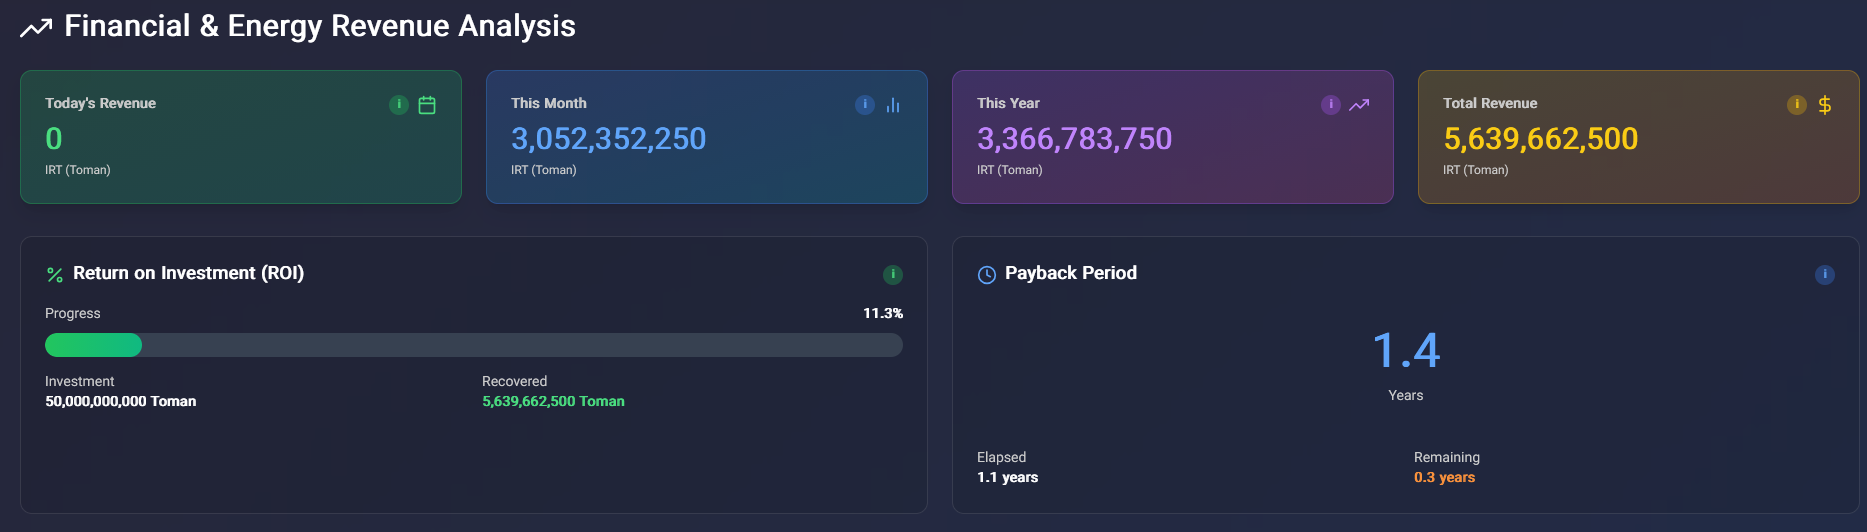
Advanced Reports
Generate standards-compliant PDF, Word, and Excel reports covering yield, finance, and string diagnostics.
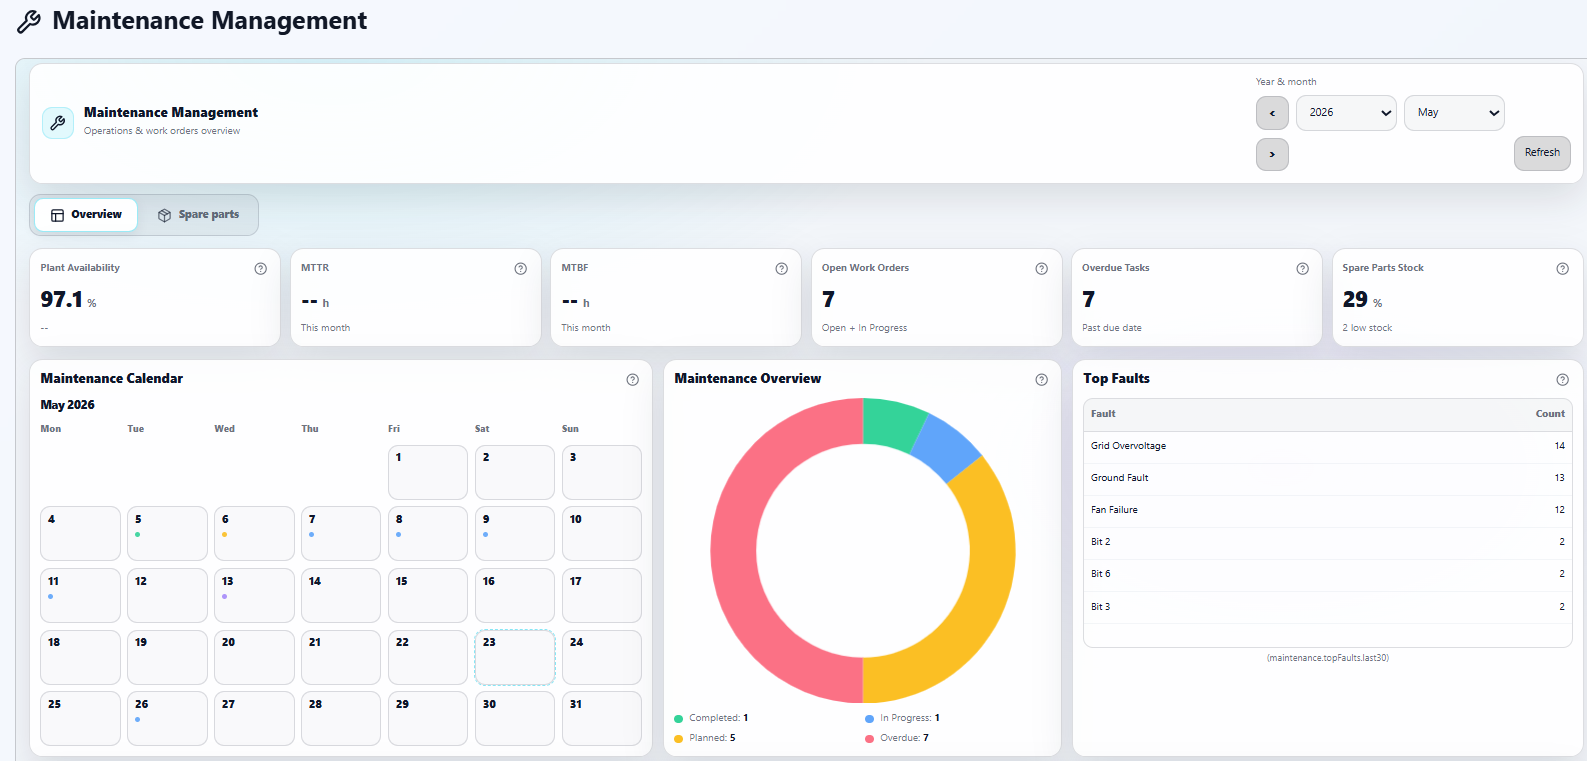
Maintenance (CMMS)
Preventive O&M scheduling, tracking active work orders, inventory control, and cost analysis.
Live Production
4.2 MW
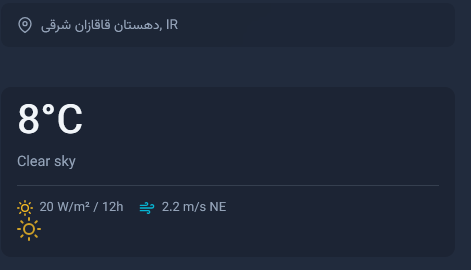
Weather
Stable
LIVE SYSTEM LOGS
11:45:01 [LINK] IEC 60870/61850 communication established with National Grid Dispatching
11:44:48 [SECURE] IEC 62443 cybersecurity intrusion audit completed - Status Secure
11:44:20 [WARN] Inverter #04 core temperature reached 68°C - Auto-derating active
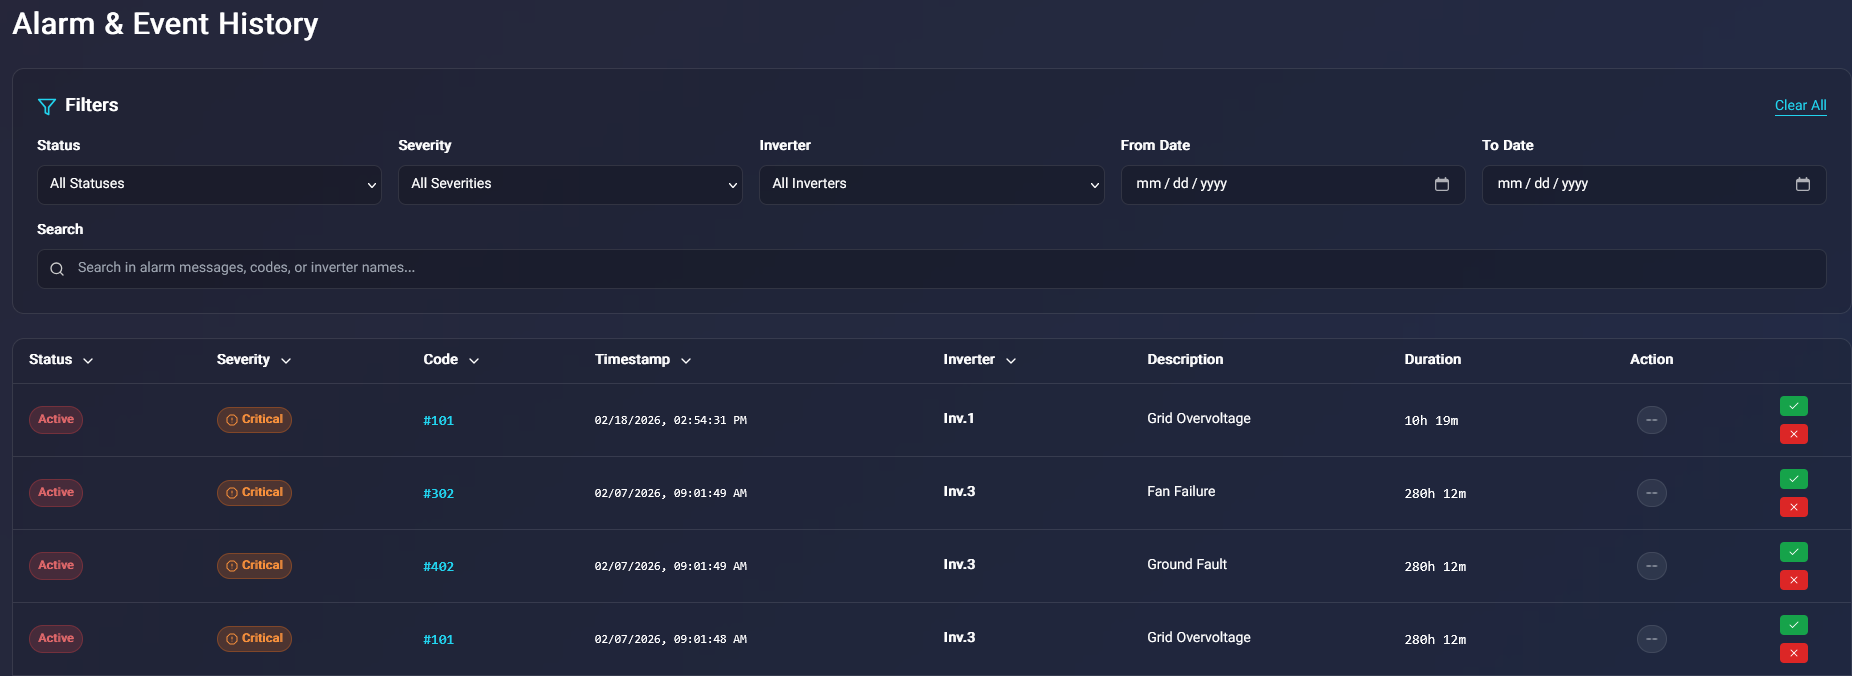
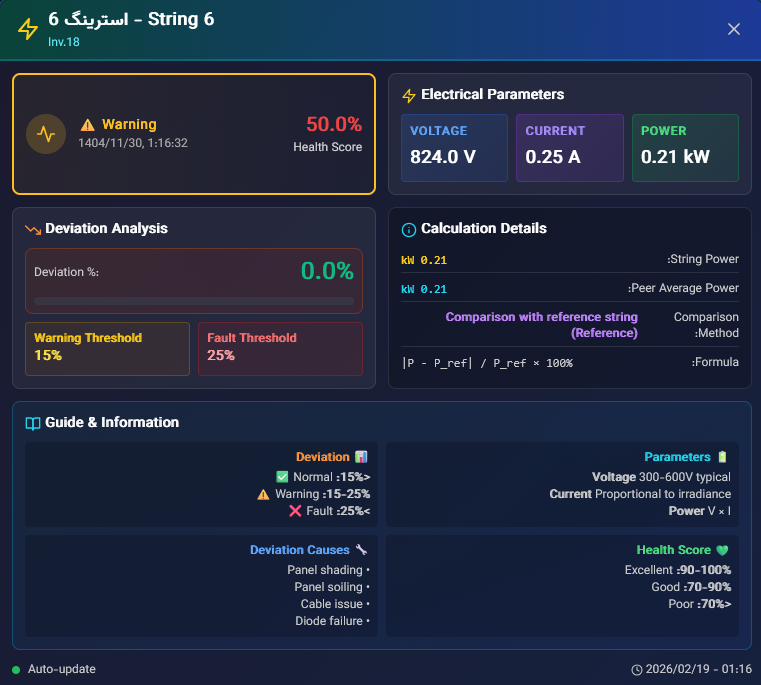
11:43:55 [FAULT] String #14-B mismatch current > 15% - Inspection recommended
11:43:10 [STABLE] Solar pyranometer value stabilized - Active power 4.225 MW
11:42:35 [O&M] Preventive PV washing cycle scheduled based on soiling index analysis
11:45:01 [LINK] IEC 60870/61850 communication established with National Grid Dispatching
11:44:48 [SECURE] IEC 62443 cybersecurity intrusion audit completed - Status Secure
11:44:20 [WARN] Inverter #04 core temperature reached 68°C - Auto-derating active
11:43:55 [FAULT] String #14-B mismatch current > 15% - Inspection recommended
11:43:10 [STABLE] Solar pyranometer value stabilized - Active power 4.225 MW
11:42:35 [O&M] Preventive PV washing cycle scheduled based on soiling index analysis