Take control of your data. Real-time monitoring, advanced analytics and full control over plant performance with a modern, stunning interface.
Comprehensive Solar SCADA Guide — Data, Reports and Standards
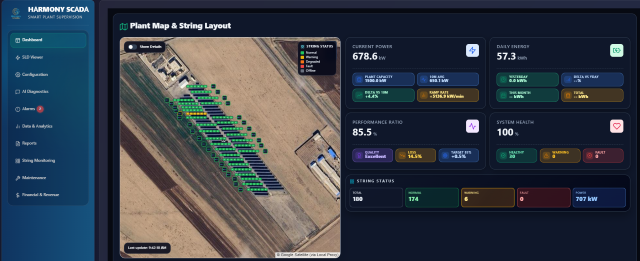
AC power, daily energy, performance ratio, inverter temperature, irradiance, string status and key performance indicators.
Data capture from equipment, storage, analysis and live display with sub-second updates.
Support for various inverters including SMA and other brands.
Production, financial, inverter comparison, meteorological and string-level reports.
Complete solution for solar farm owners and managers

Live dashboard for production, energy, inverters, pyranometer and KPIs.

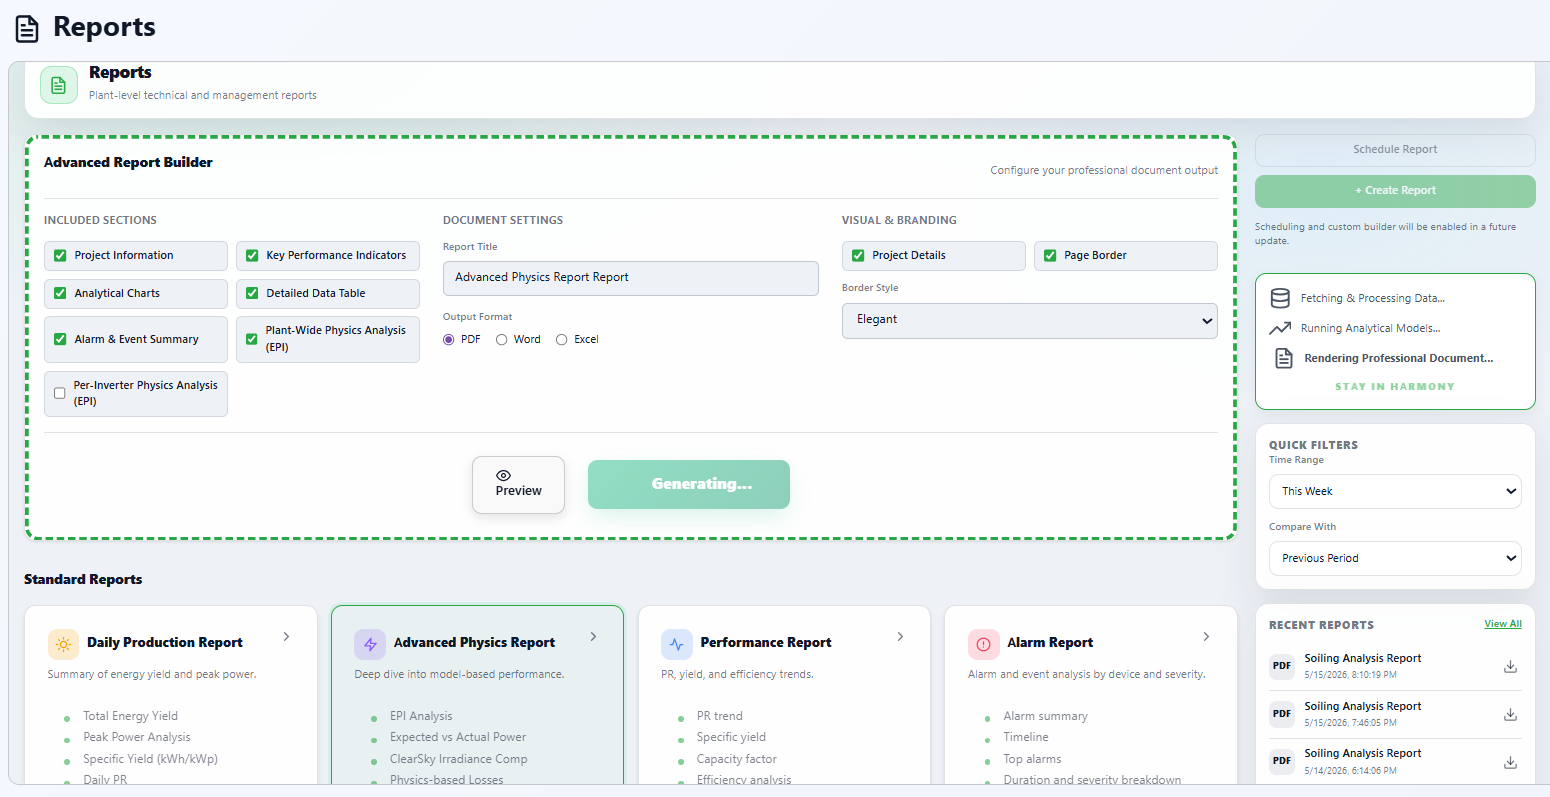
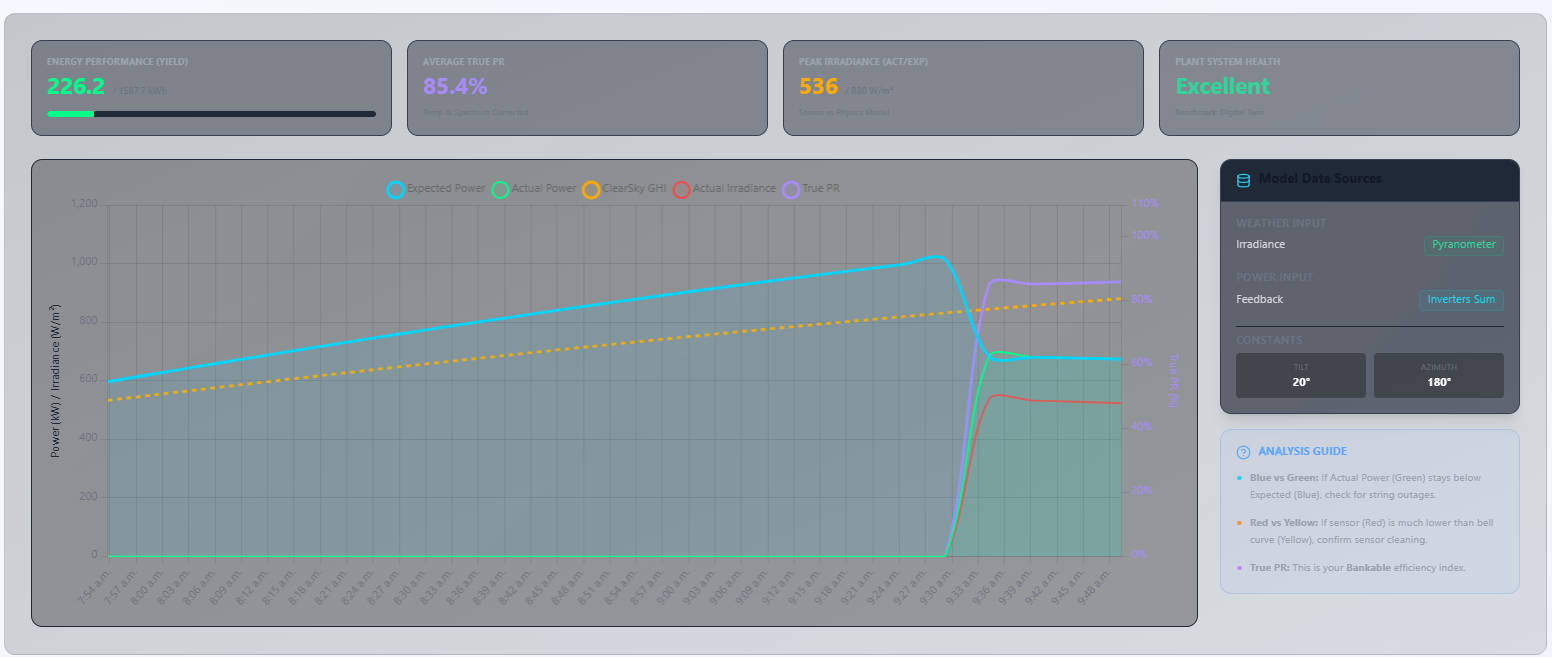
Professional PDF/Word/Excel reports based on IEC 61724, physical EPI model, string mismatch, and soiling analysis.

Revenue, monthly comparison and per-inverter performance breakdown.

Instant notification of faults via SMS and email.

Current and voltage analysis with peer-to-peer comparison.

Inverter and zone placement, offline support.

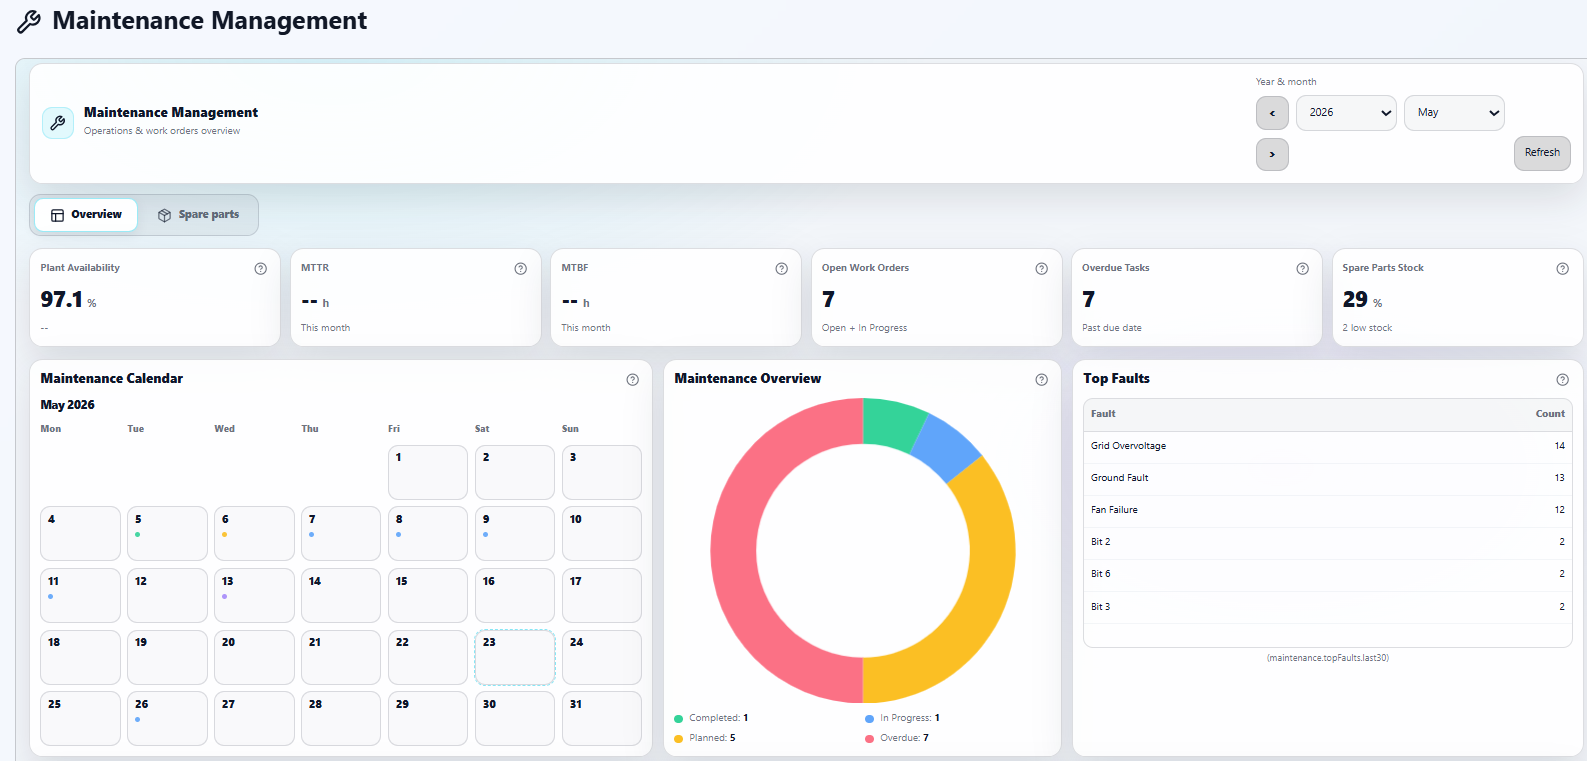
Preventive O&M scheduling, work orders, spare parts inventory, and cost analytics.

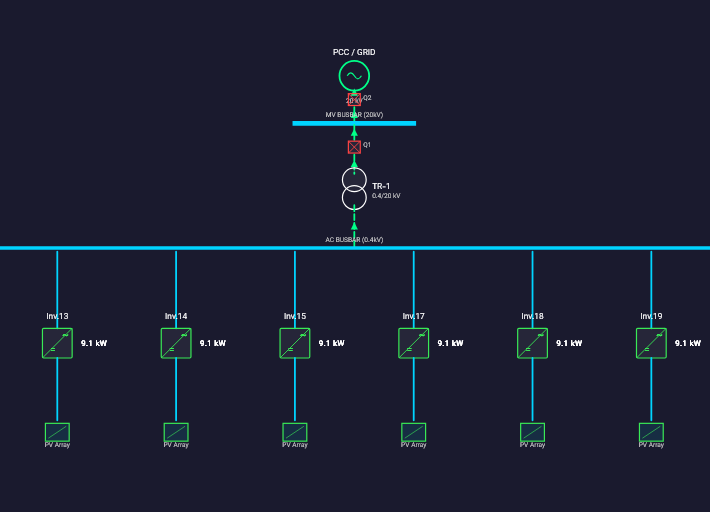
Professional single-line diagram and equipment placement.

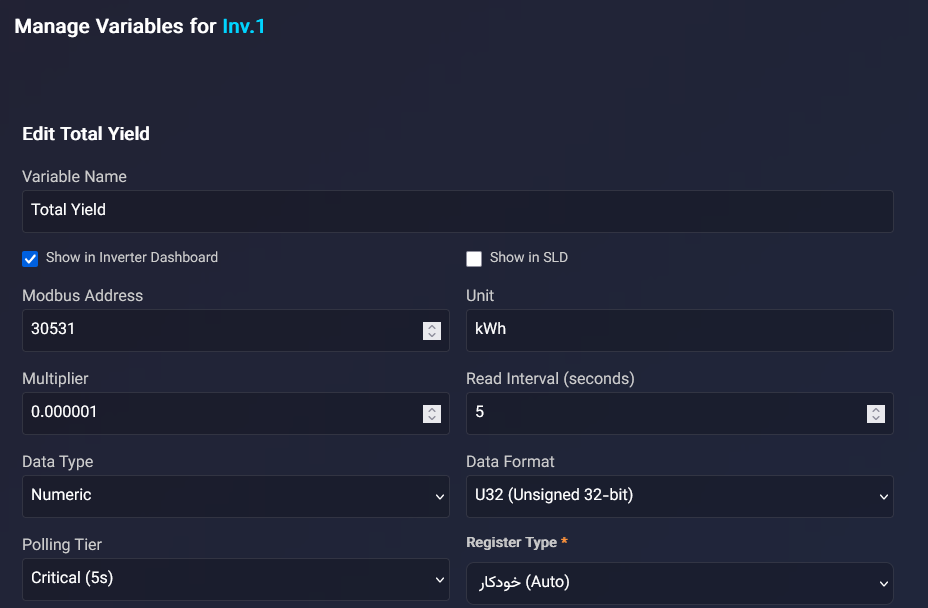
Register read/write, Tier-based Polling and remote control.

Tier-based control, prioritization for speed and reliability.

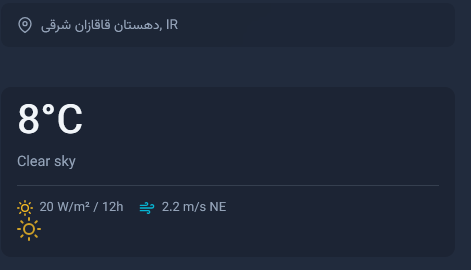
5-day forecast and pyranometer data.

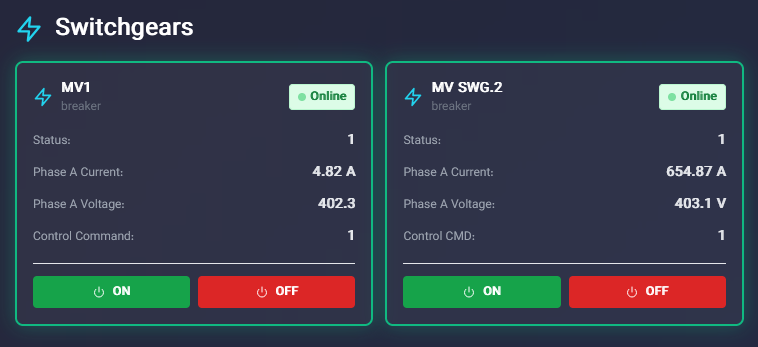
Status display and open/close control.

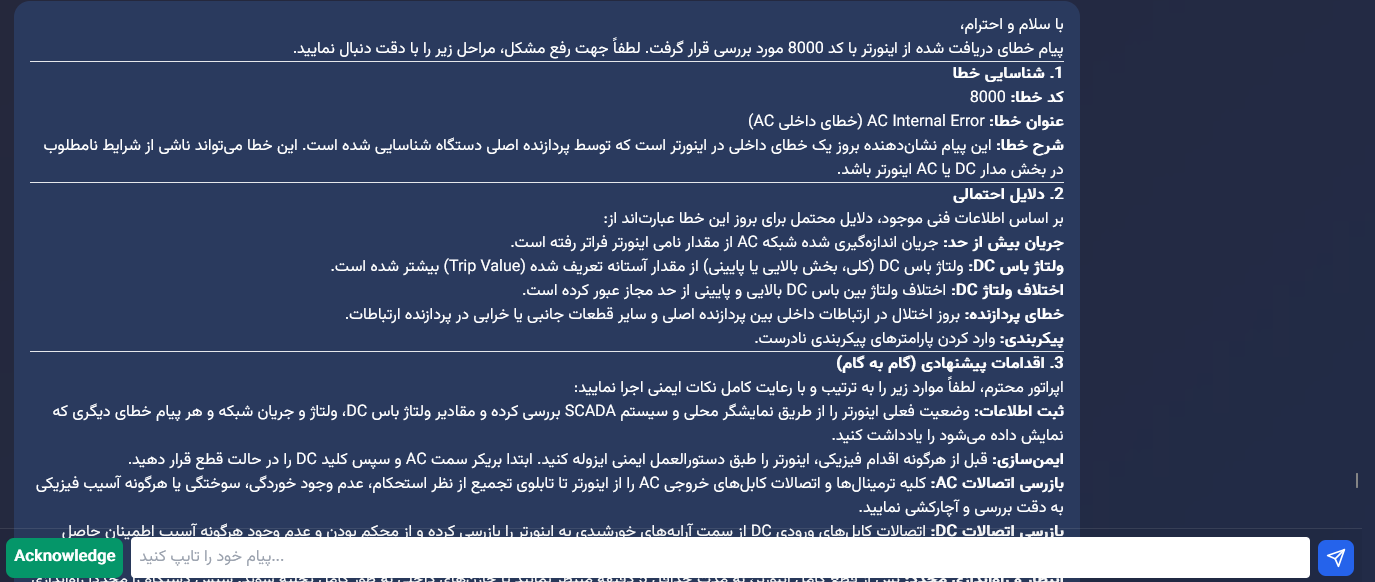
Automatic fault detection, chat assistant and knowledge base.

Persian, English, German, Dutch, Turkish, Arabic and Chinese.

Web interface — no client install, access from any device.

BESS, tracker, satellite data, CMMS and grid protocols (upon request).
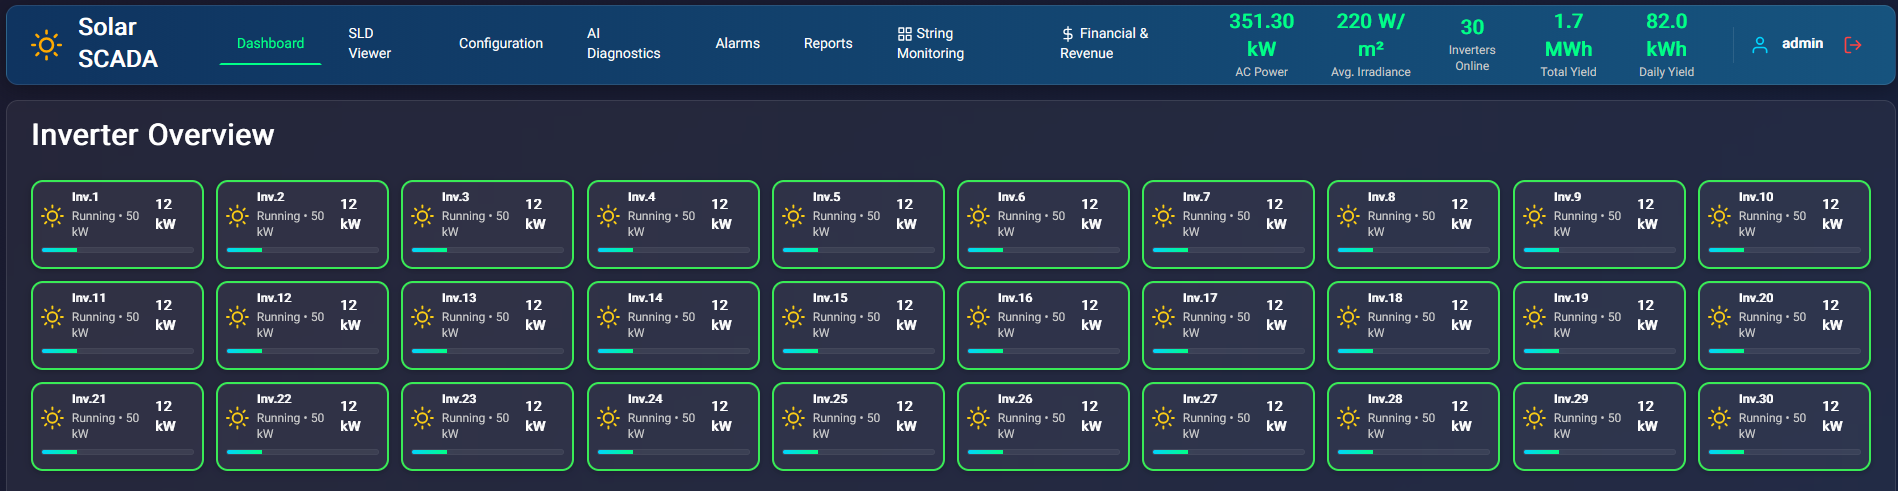
The main Harmony SCADA dashboard displays all vital plant data with live updates and sub-second resolution.
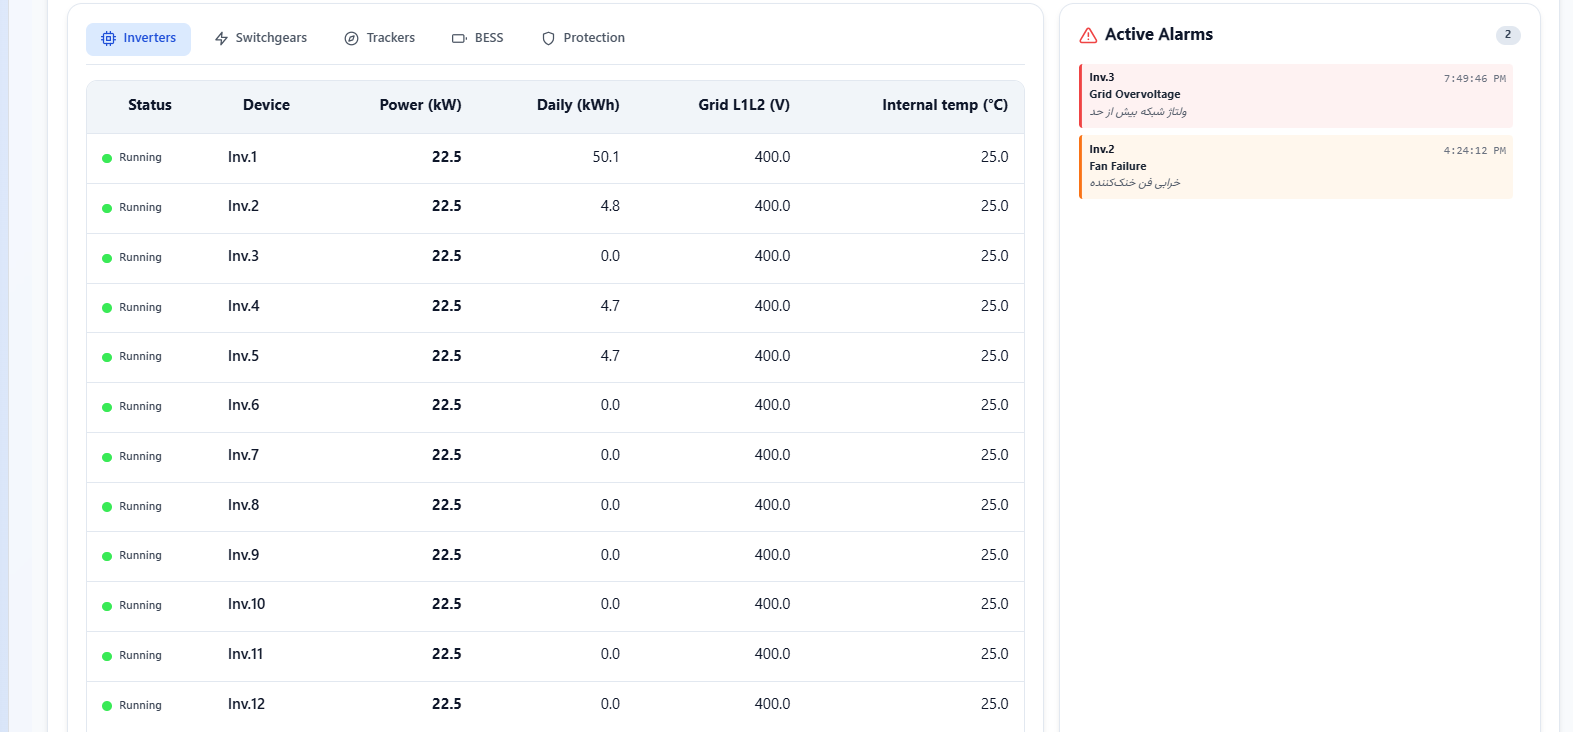
After logging in, you see the plant overview at a glance. Click any inverter for more details. Data updates with sub-second resolution.
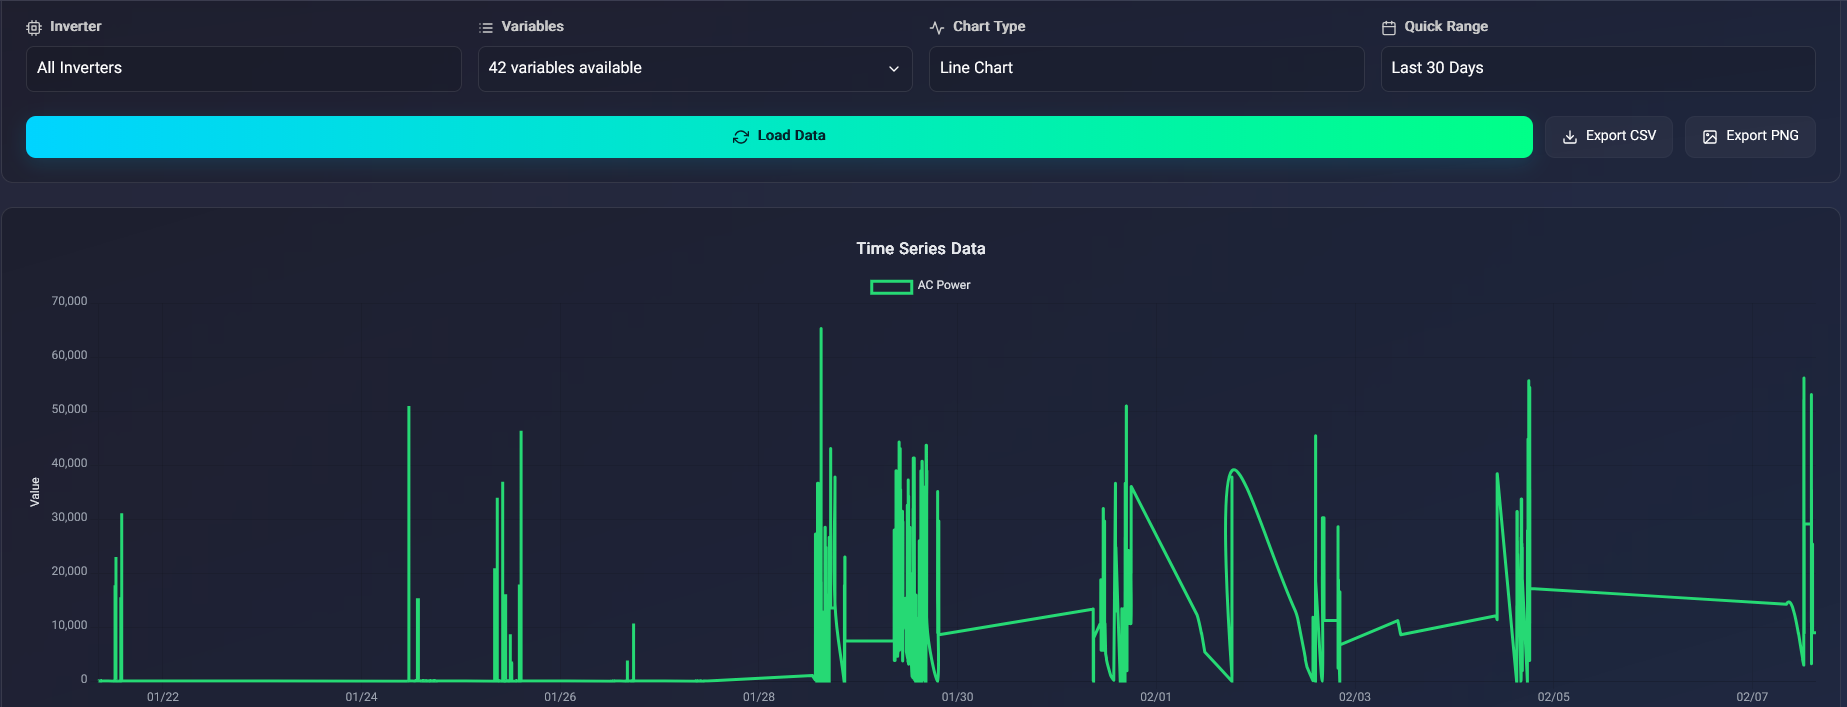
The Harmony SCADA reporting system generates highly detailed technical, financial, and managerial reports compliant with solar power plant standards.
Connect to inverters via standard Modbus and SunSpec protocols. Features: variable definition, auto polling, manual read/write, remote control. Supports SMA and other Modbus/SunSpec-compatible inverters.
Single Line Diagram design with IEC 60617 symbols, smart connections, gauges and live charts. Drag & drop, multi-sheet support. Symbols link to inverters for real-time data display.
Harmony SCADA is built on HTML5 web technology. No client install, centralized updates, Canvas graphics for SLD and charts, WebSocket for real-time data. Same interface on mobile, tablet and desktop.
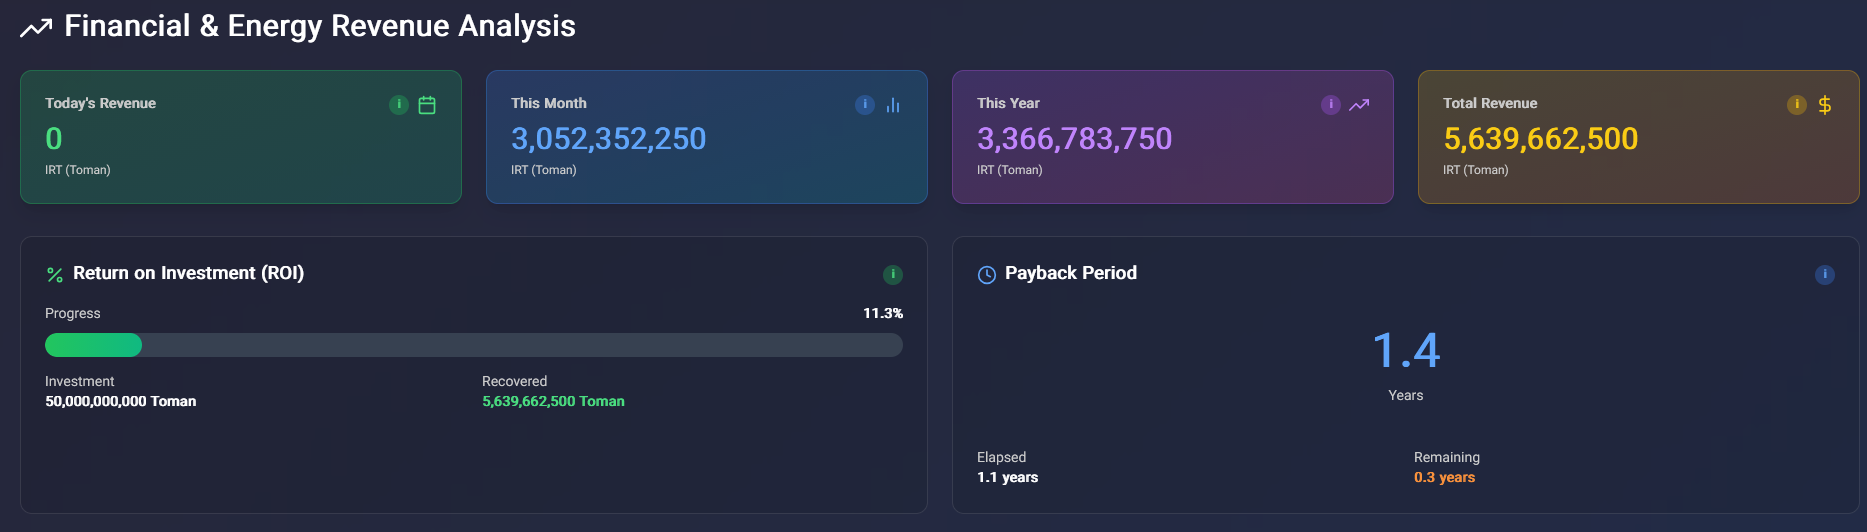
Monitor revenue, costs and return on investment of the solar plant.
Electricity price, system cost, commissioning date and other parameters are configurable in dashboard settings.
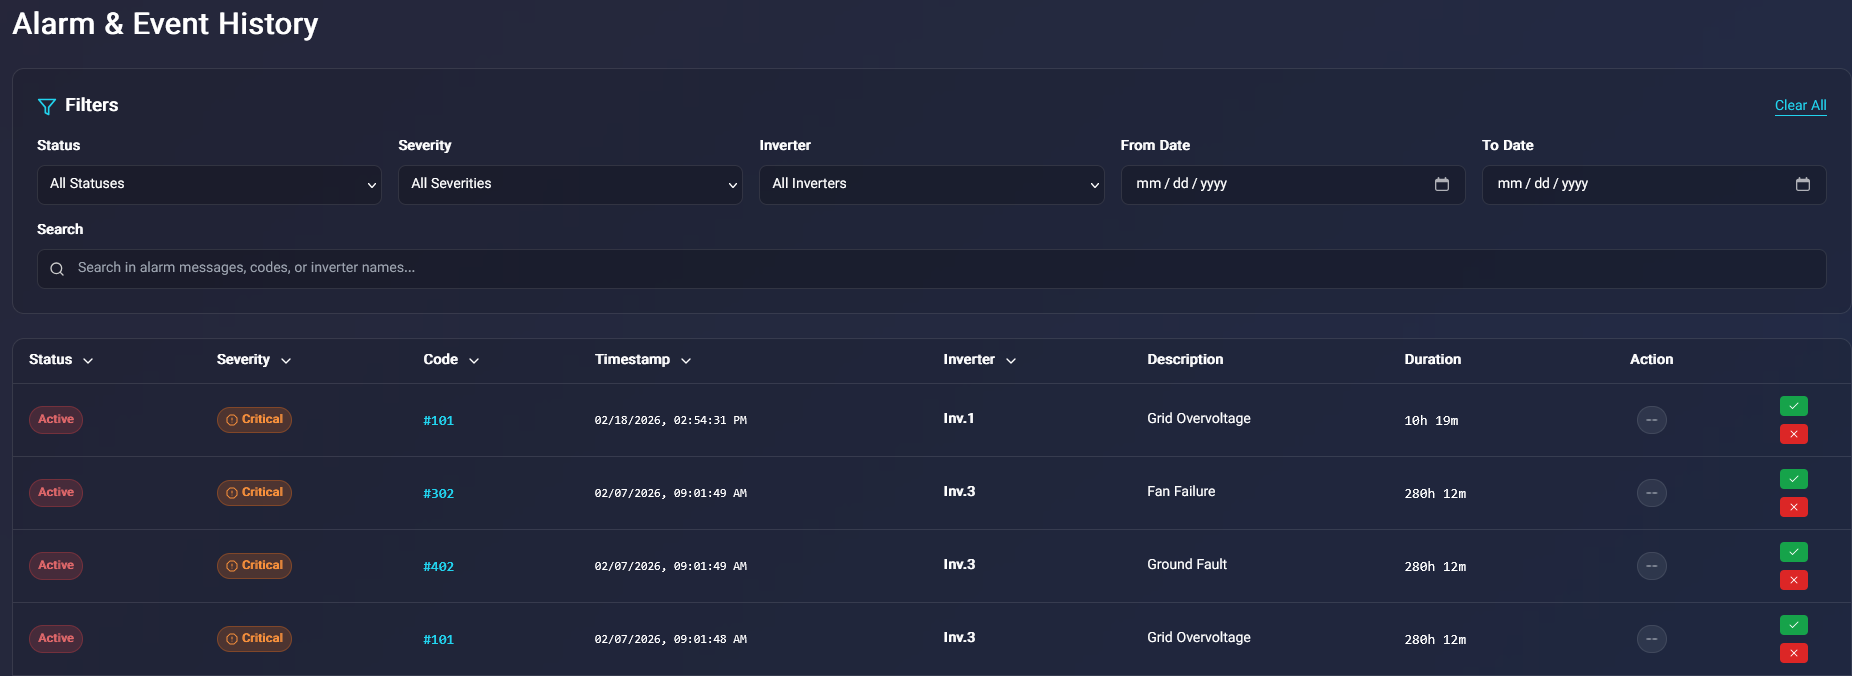
Instant notification of faults and important plant events.
Alarms based on inverter fault codes, status codes, and user-defined conditions. Each code can have description, severity and suggested action.
Acknowledge and clear alarms in bulk, view history.
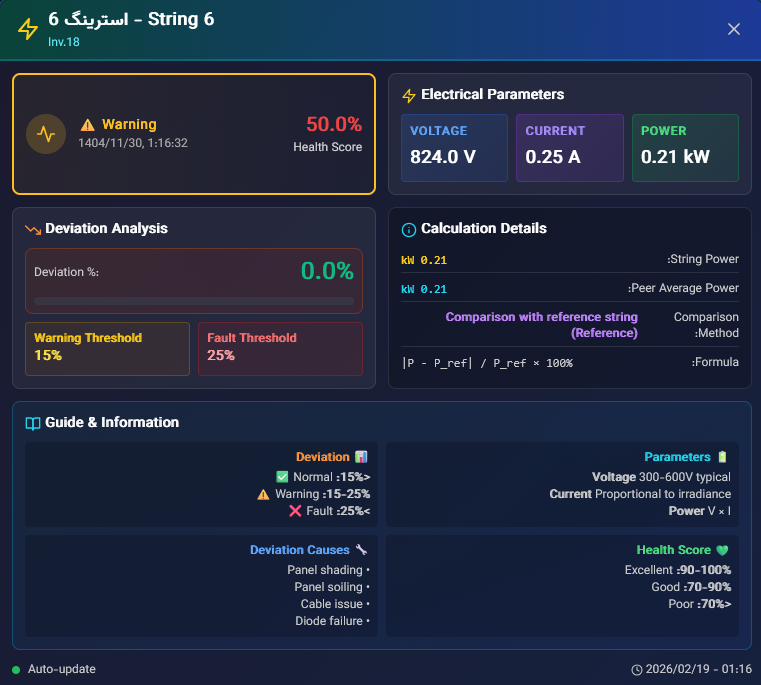
Analyze each string and identify underperforming strings.
Strings of one inverter are compared to quickly find faulty or shaded strings.
Alerts when current or voltage drops abnormally.
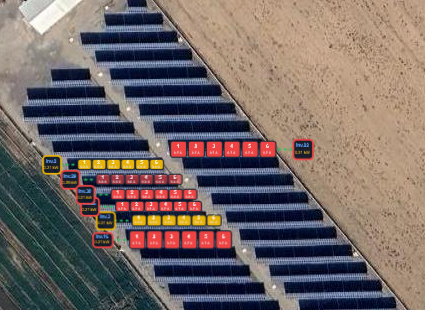
Display inverter and zone layout on satellite map.
Site center coordinates, map download radius and layers configurable in project settings.
The integrated Harmony SCADA Maintenance Management System (MMS/CMMS) is designed to plan, track, and optimize preventive and corrective maintenance activities across the solar power plant.
Full control over requests sent to inverters and equipment. Tier-based request management for optimal speed and reliability.
Poll intervals for each tier are configurable in project settings.
Request delay between reads, max requests per cycle, parallel workers for faster multi-inverter reading. Automatic prioritization for control commands.
Weather data and forecast for planning and analysis.
5-day weather forecast for maintenance planning and production analysis.
PR (Performance Ratio) calculation per IEC 61724 standard. Compare actual vs expected production from irradiance.
Display status and open/close control of switchgear and substation equipment.
Commands require authentication and two-step confirmation. All actions logged. Design aligned with IEC 62443 cybersecurity standard.
AI-based assistant for fault diagnosis and answering questions.
Ask any question about the plant, faults or performance and get text answers.
Upload manuals and technical docs (PDF, Word, Excel) to improve assistant answers with your project content.
Works online with cloud or fully local without internet.
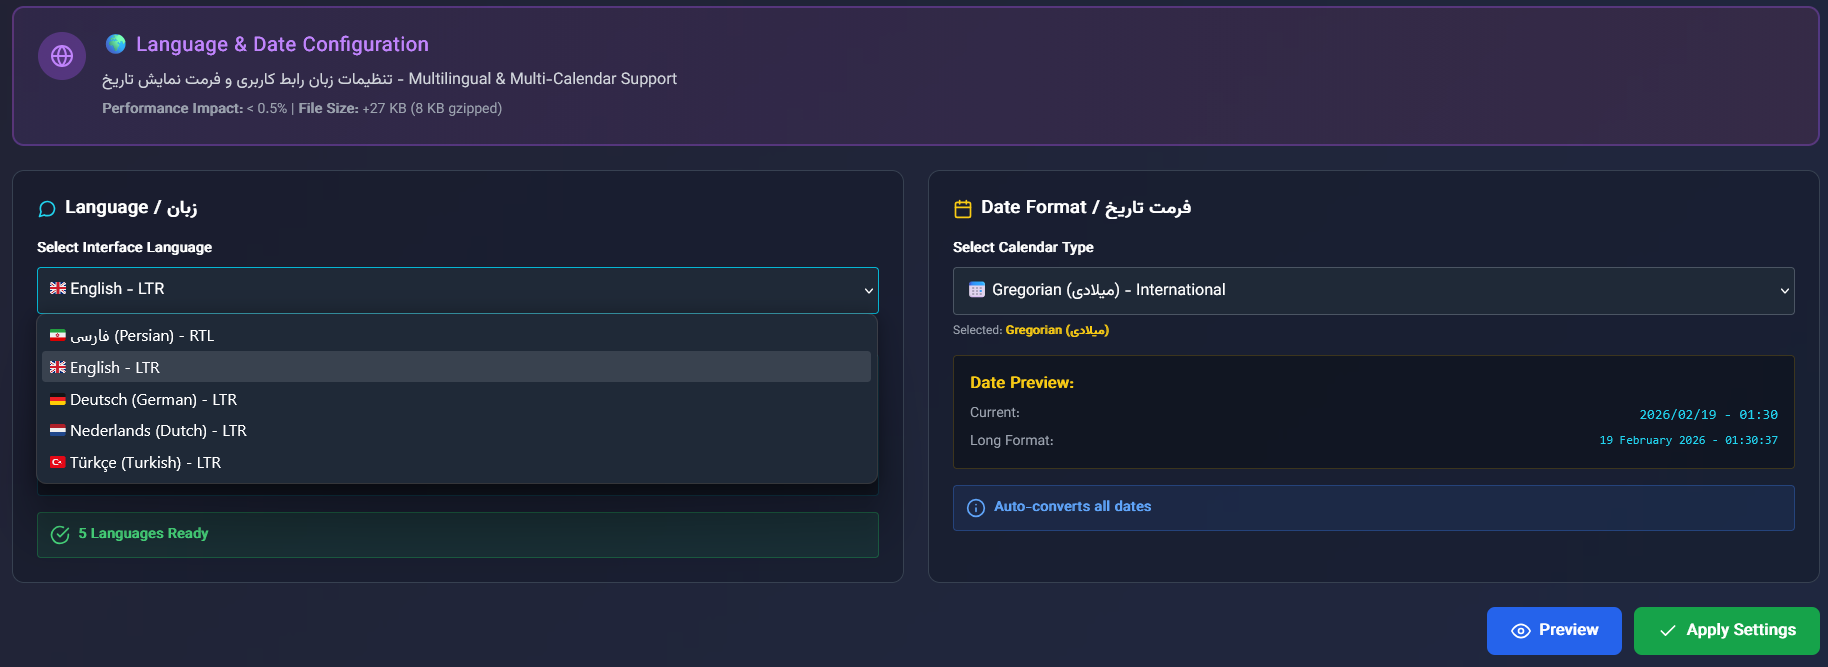
Harmony SCADA interface supports multiple languages.
Gregorian and Jalali (Solar) calendar for dates and reports.
Select language from settings or top bar. Selection is saved.
Advanced features can be added to the project upon client request.
These capabilities can be implemented per project based on client needs.
Solution for all solar plant stakeholders
Monitor production, revenue and performance without physical presence.
Manage multiple projects and deliver reports to clients.
Quick fault identification and maintenance scheduling.
Performance transparency and KPIs for decision-making.
Design team, flexibility and AI assistant
Harmony SCADA is the product of a professional software team, process engineers and solar plant designers built with real solar farm needs in mind.
Every plant is unique. Harmony SCADA is designed for client-requested changes: custom KPIs, report settings, alarm config and dashboard customization.


Humanir supports commercial, contractual and project coordination, while the Harmony SCADA team provides specialist software design, implementation and support.
Concise answers to common technical and deployment questions about Harmony SCADA connectivity, reporting, operation, and support
It is designed for small to large solar power plants and multi-site portfolios. The project structure, inverter count, metering equipment, and required feature set are configured for each plant during commissioning.
Standard connectivity is provided through Modbus TCP/RTU and SunSpec, with configurable register maps for different inverter brands. Grid protocols such as IEC 60870-5-104, IEC 61850, and DNP3 can also be implemented according to project requirements.
AC/DC power and energy, inverter status and temperature, string current and voltage, irradiance, ambient and module temperature, and revenue-meter data can be monitored. Performance ratio, availability, expected yield, and project-specific KPIs can also be calculated.
No. The HTML5 web interface is accessed through a browser on desktop, tablet, or mobile devices. Application updates are managed centrally on the server.
Yes. The core SCADA system can run entirely on the plant's local network without relying on the public internet. Cloud services, external data sources, and selected AI features are enabled only when required and when network access is available.
Communication loss, inverter stops, underperformance, and abnormal operating conditions are recorded and displayed on the dashboard. Event history, severity, and acknowledgement status are retained, while notification methods can be configured for the project.
Yes. Production, financial, alarm, weather, inverter-comparison, and string-analysis reports can be generated for custom time ranges. PDF and Excel output, project branding, templates, and scheduled report delivery can be configured for the owner's requirements.
String current and voltage are compared with peer groups to identify hidden losses, mismatch, shading, soiling, or possible disconnection earlier. Color-coded string status helps O&M teams target the correct area before visiting the field.
Yes. Harmony SCADA compares actual yield with expected production using irradiance and temperature data and provides indicators such as PR. With tariff and financial parameters configured, revenue, lost production, and period-over-period performance can also be evaluated.
The site map places inverters and zones on a geographic map and supports cached offline map tiles. The SLD Designer provides live single-line diagrams with IEC 60617 symbols, real-time values, multiple sheets, and connected equipment objects.
Corrective and preventive maintenance requests, work orders, service schedules, asset history, and spare parts can be managed in the module. Linking SCADA events to maintenance activities makes it easier to track an issue from the initial alarm through final resolution.
The AI assistant can explain faults, suggest troubleshooting steps, and answer operator questions using uploaded project documents. Answer quality depends on available data and documentation, while sensitive decisions and commands still require confirmation by an authorized user.
When control is enabled, commands are sent only after authentication and confirmation by an authorized user, and actions are recorded in the audit log. Security architecture and access levels are adapted to the owner's network policies, following an approach aligned with IEC 62443 principles.
The interface supports Persian, English, German, Dutch, Turkish, Arabic, and Chinese. Dates and reports can use either the Gregorian or Jalali calendar.
Yes. KPIs, dashboards, alarms, reports, equipment maps, and integrations can be configured for the project. Requirements analysis, commissioning, user training, and technical support are provided according to the agreed project scope.
Everything in a modern, fast interface
Real-time monitoring of production, energy and inverter performance
Inverter placement on satellite map, offline and online
Persian, English, German, Dutch, Turkish, Arabic and Chinese
Access from mobile, tablet and desktop without installation
Project details help us prepare a session tailored to your plant capacity, equipment and actual requirements.